Can you tell us a bit about yourself and what you do? I'm an academic who enjoys working with...
Can you tell us a bit about yourself and what you do? I'm an academic who enjoys working with...

Can you tell us a bit about yourself and what you do? I joined N Brown in February 2024 as Chief...
Can you tell us a bit about yourself and what you do? I combine my corporate experience with...
Can you tell us a bit about yourself and what you do? I’m Nick Holmes, VP of Learning and Culture...

Written by Marie-Alice Tantardini, Chief People and Fulfilment Officer at PayFit

By Ed Creasey, Vice President of Solution Engineering at Calabrio
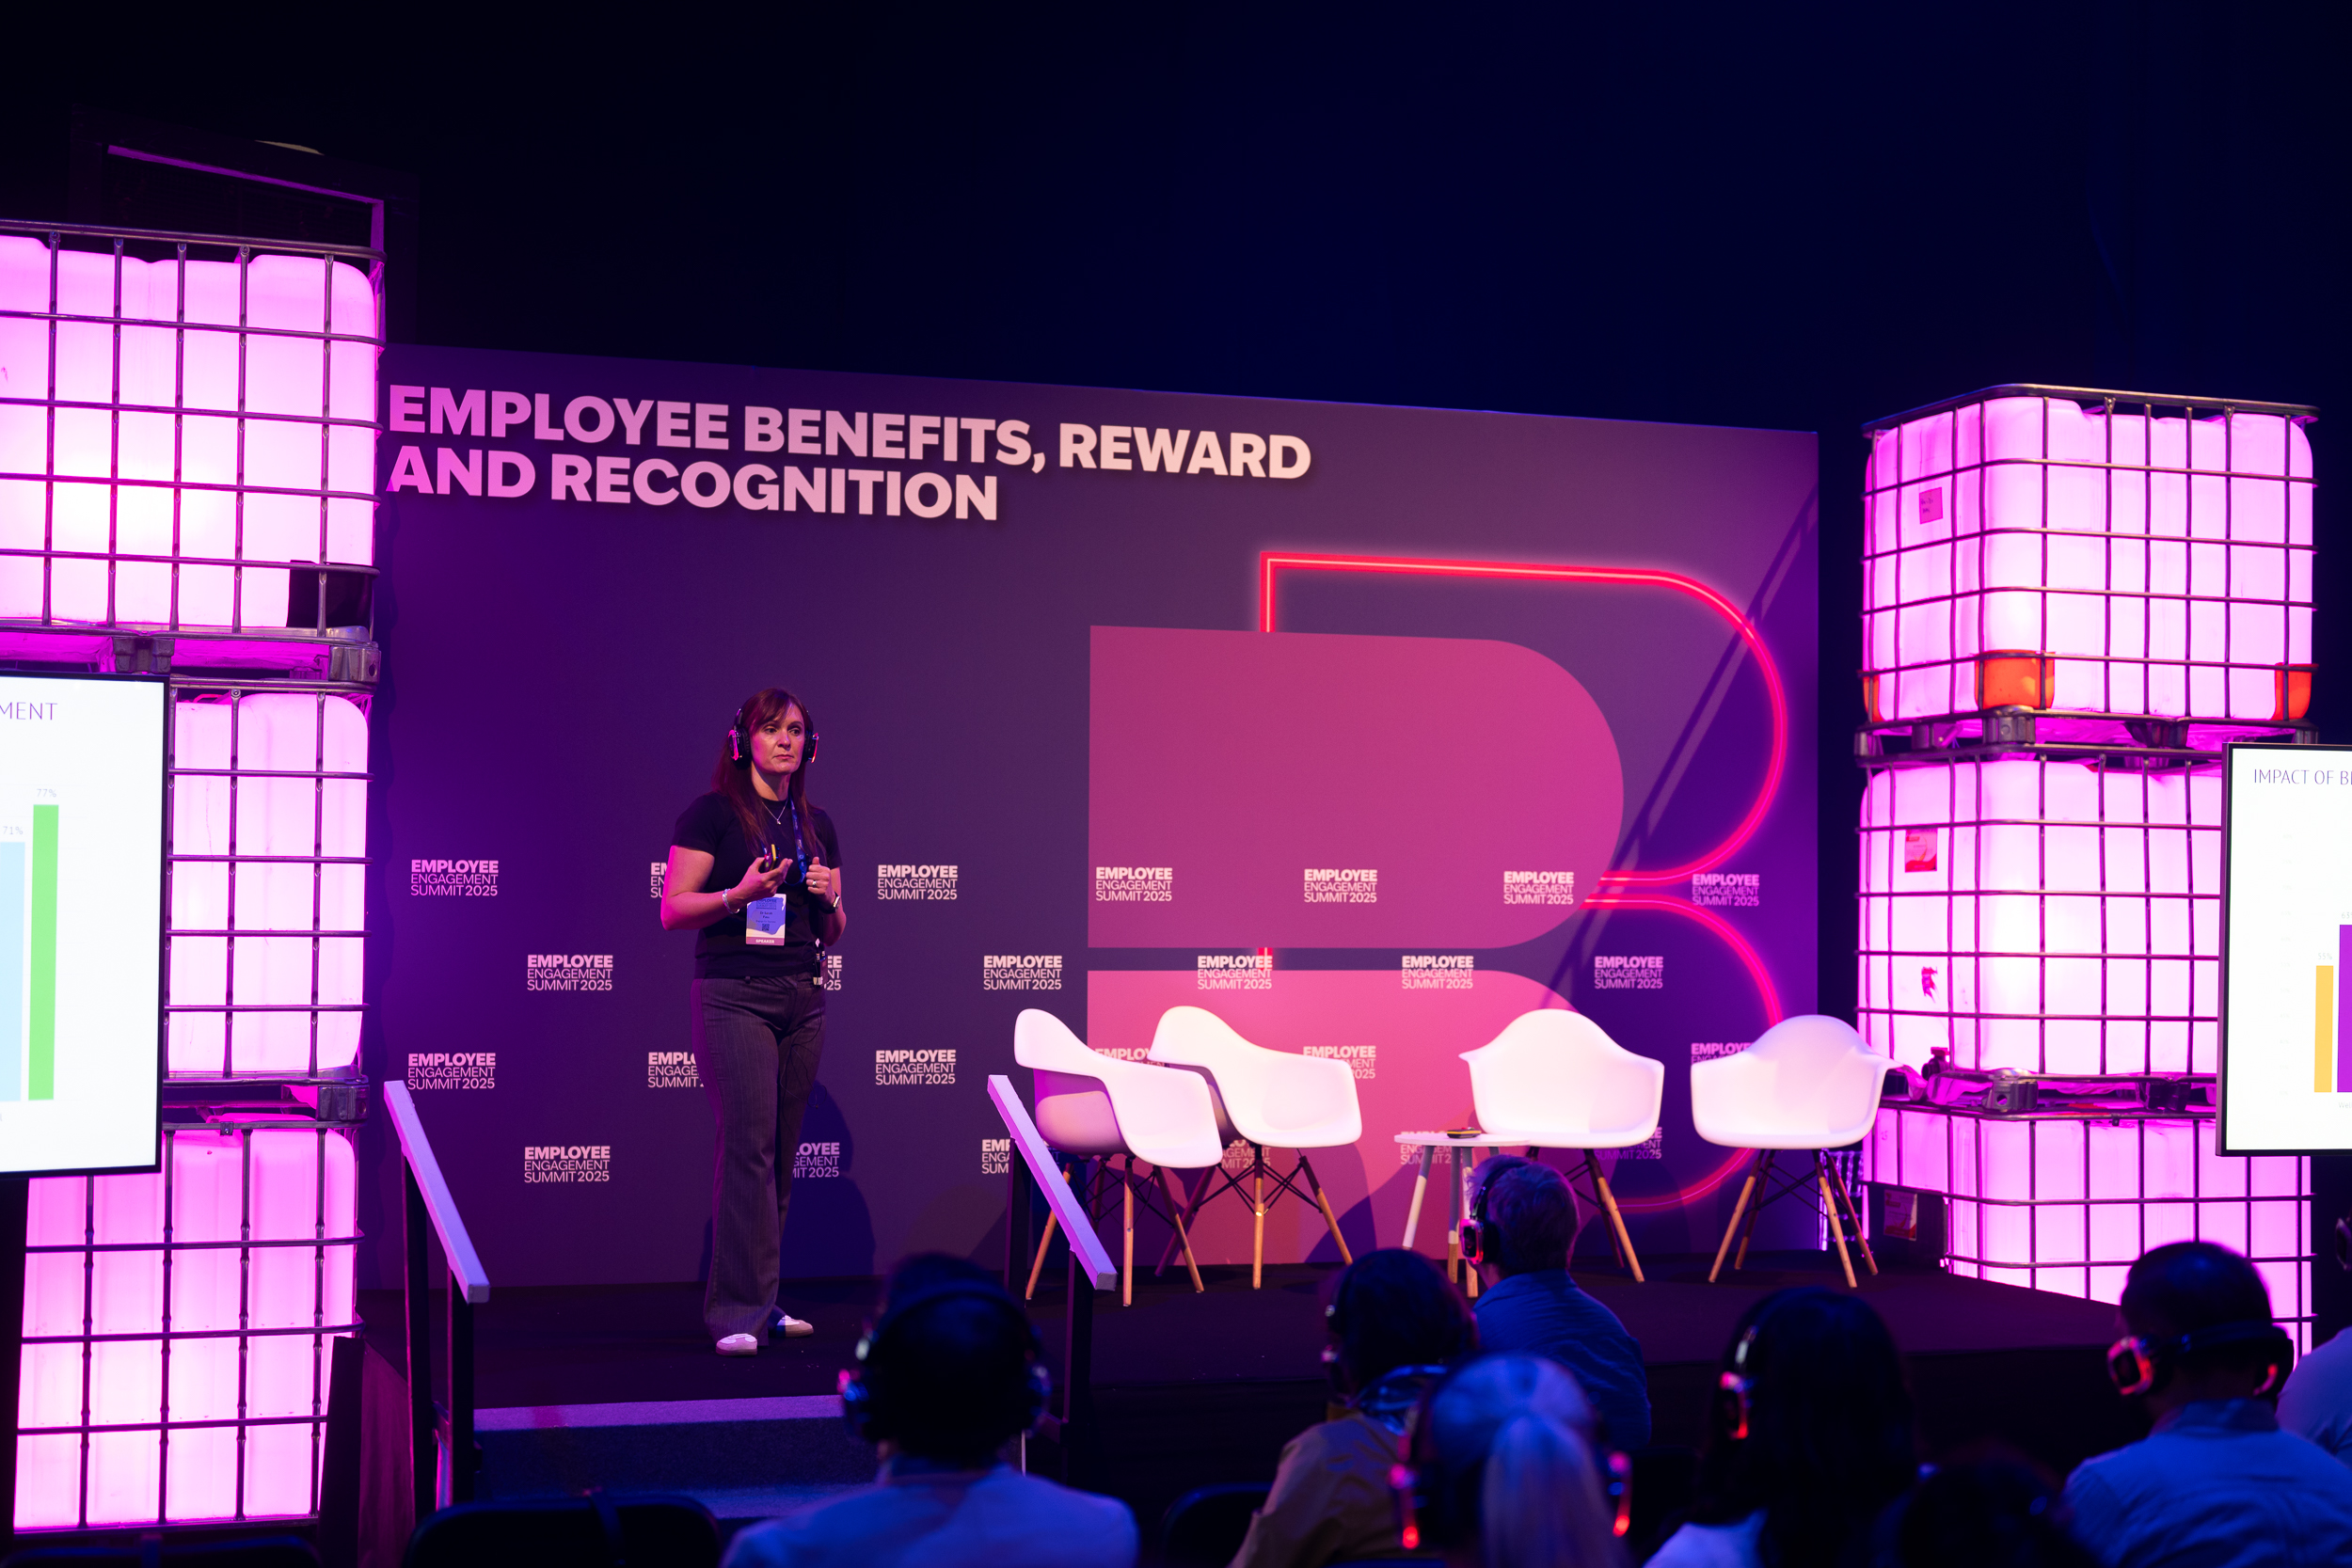
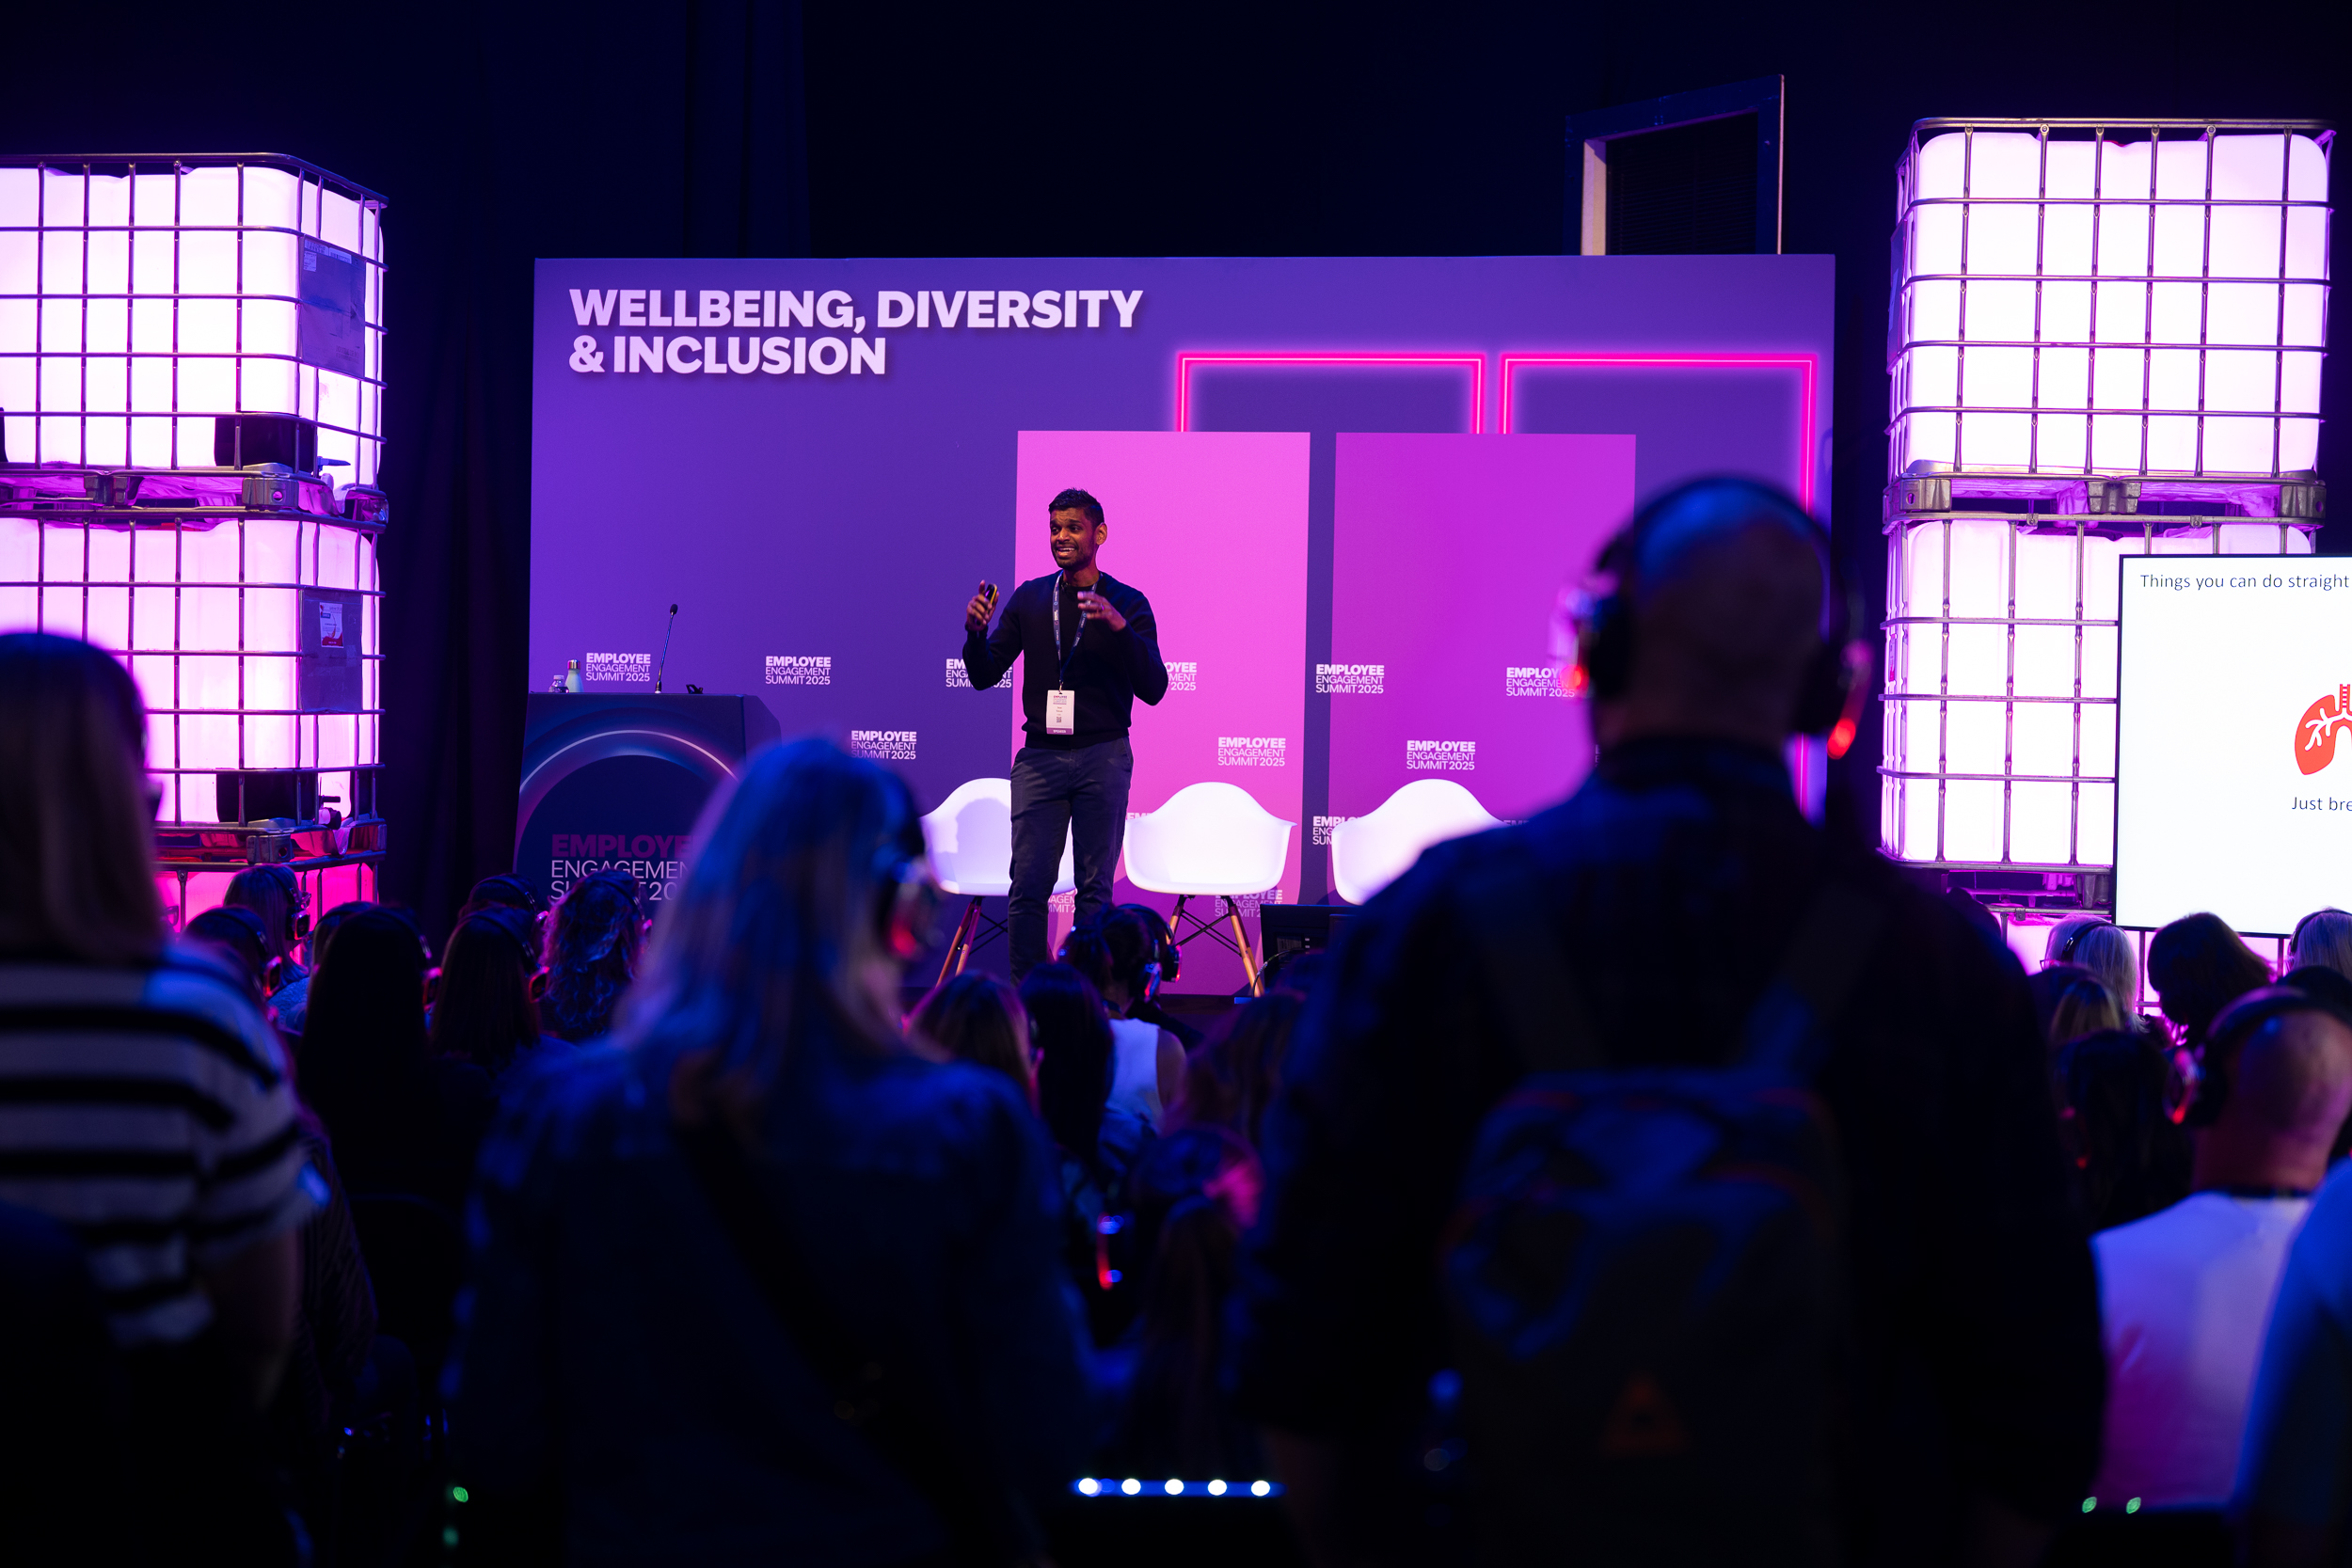
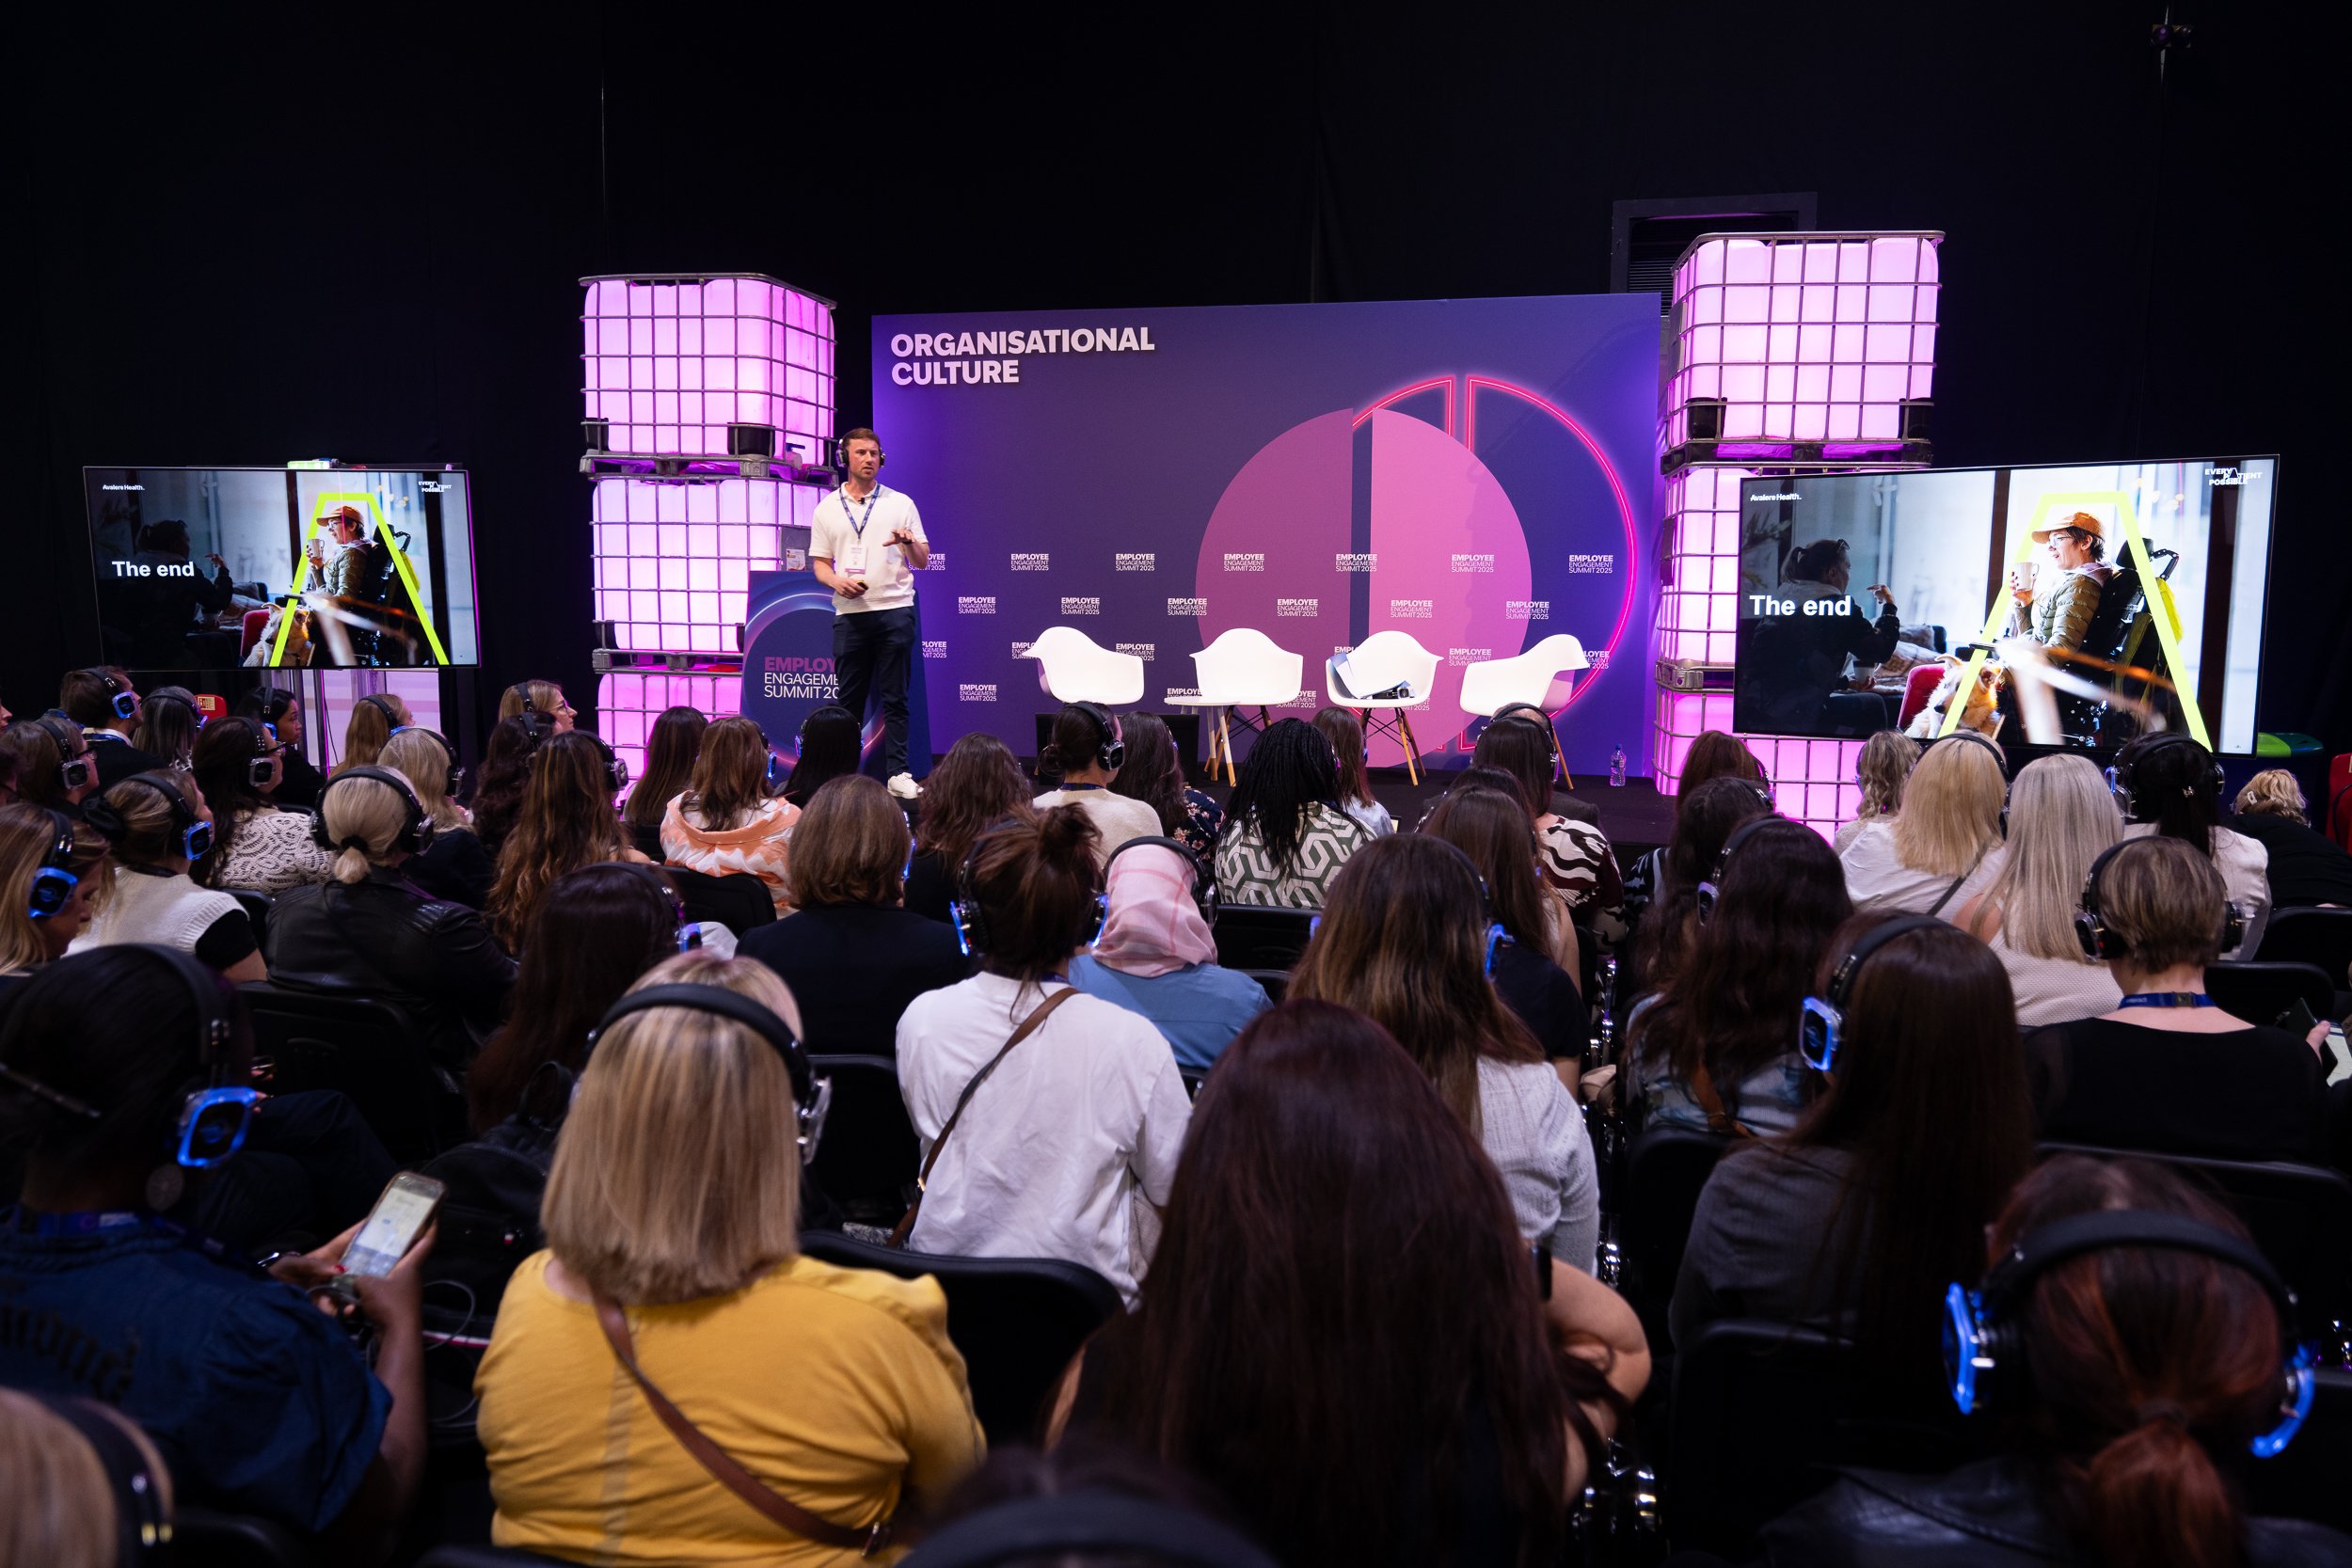
London, UK – On 22nd May 2025, the free-to-attend Employee Engagement Summit marks its 10th...

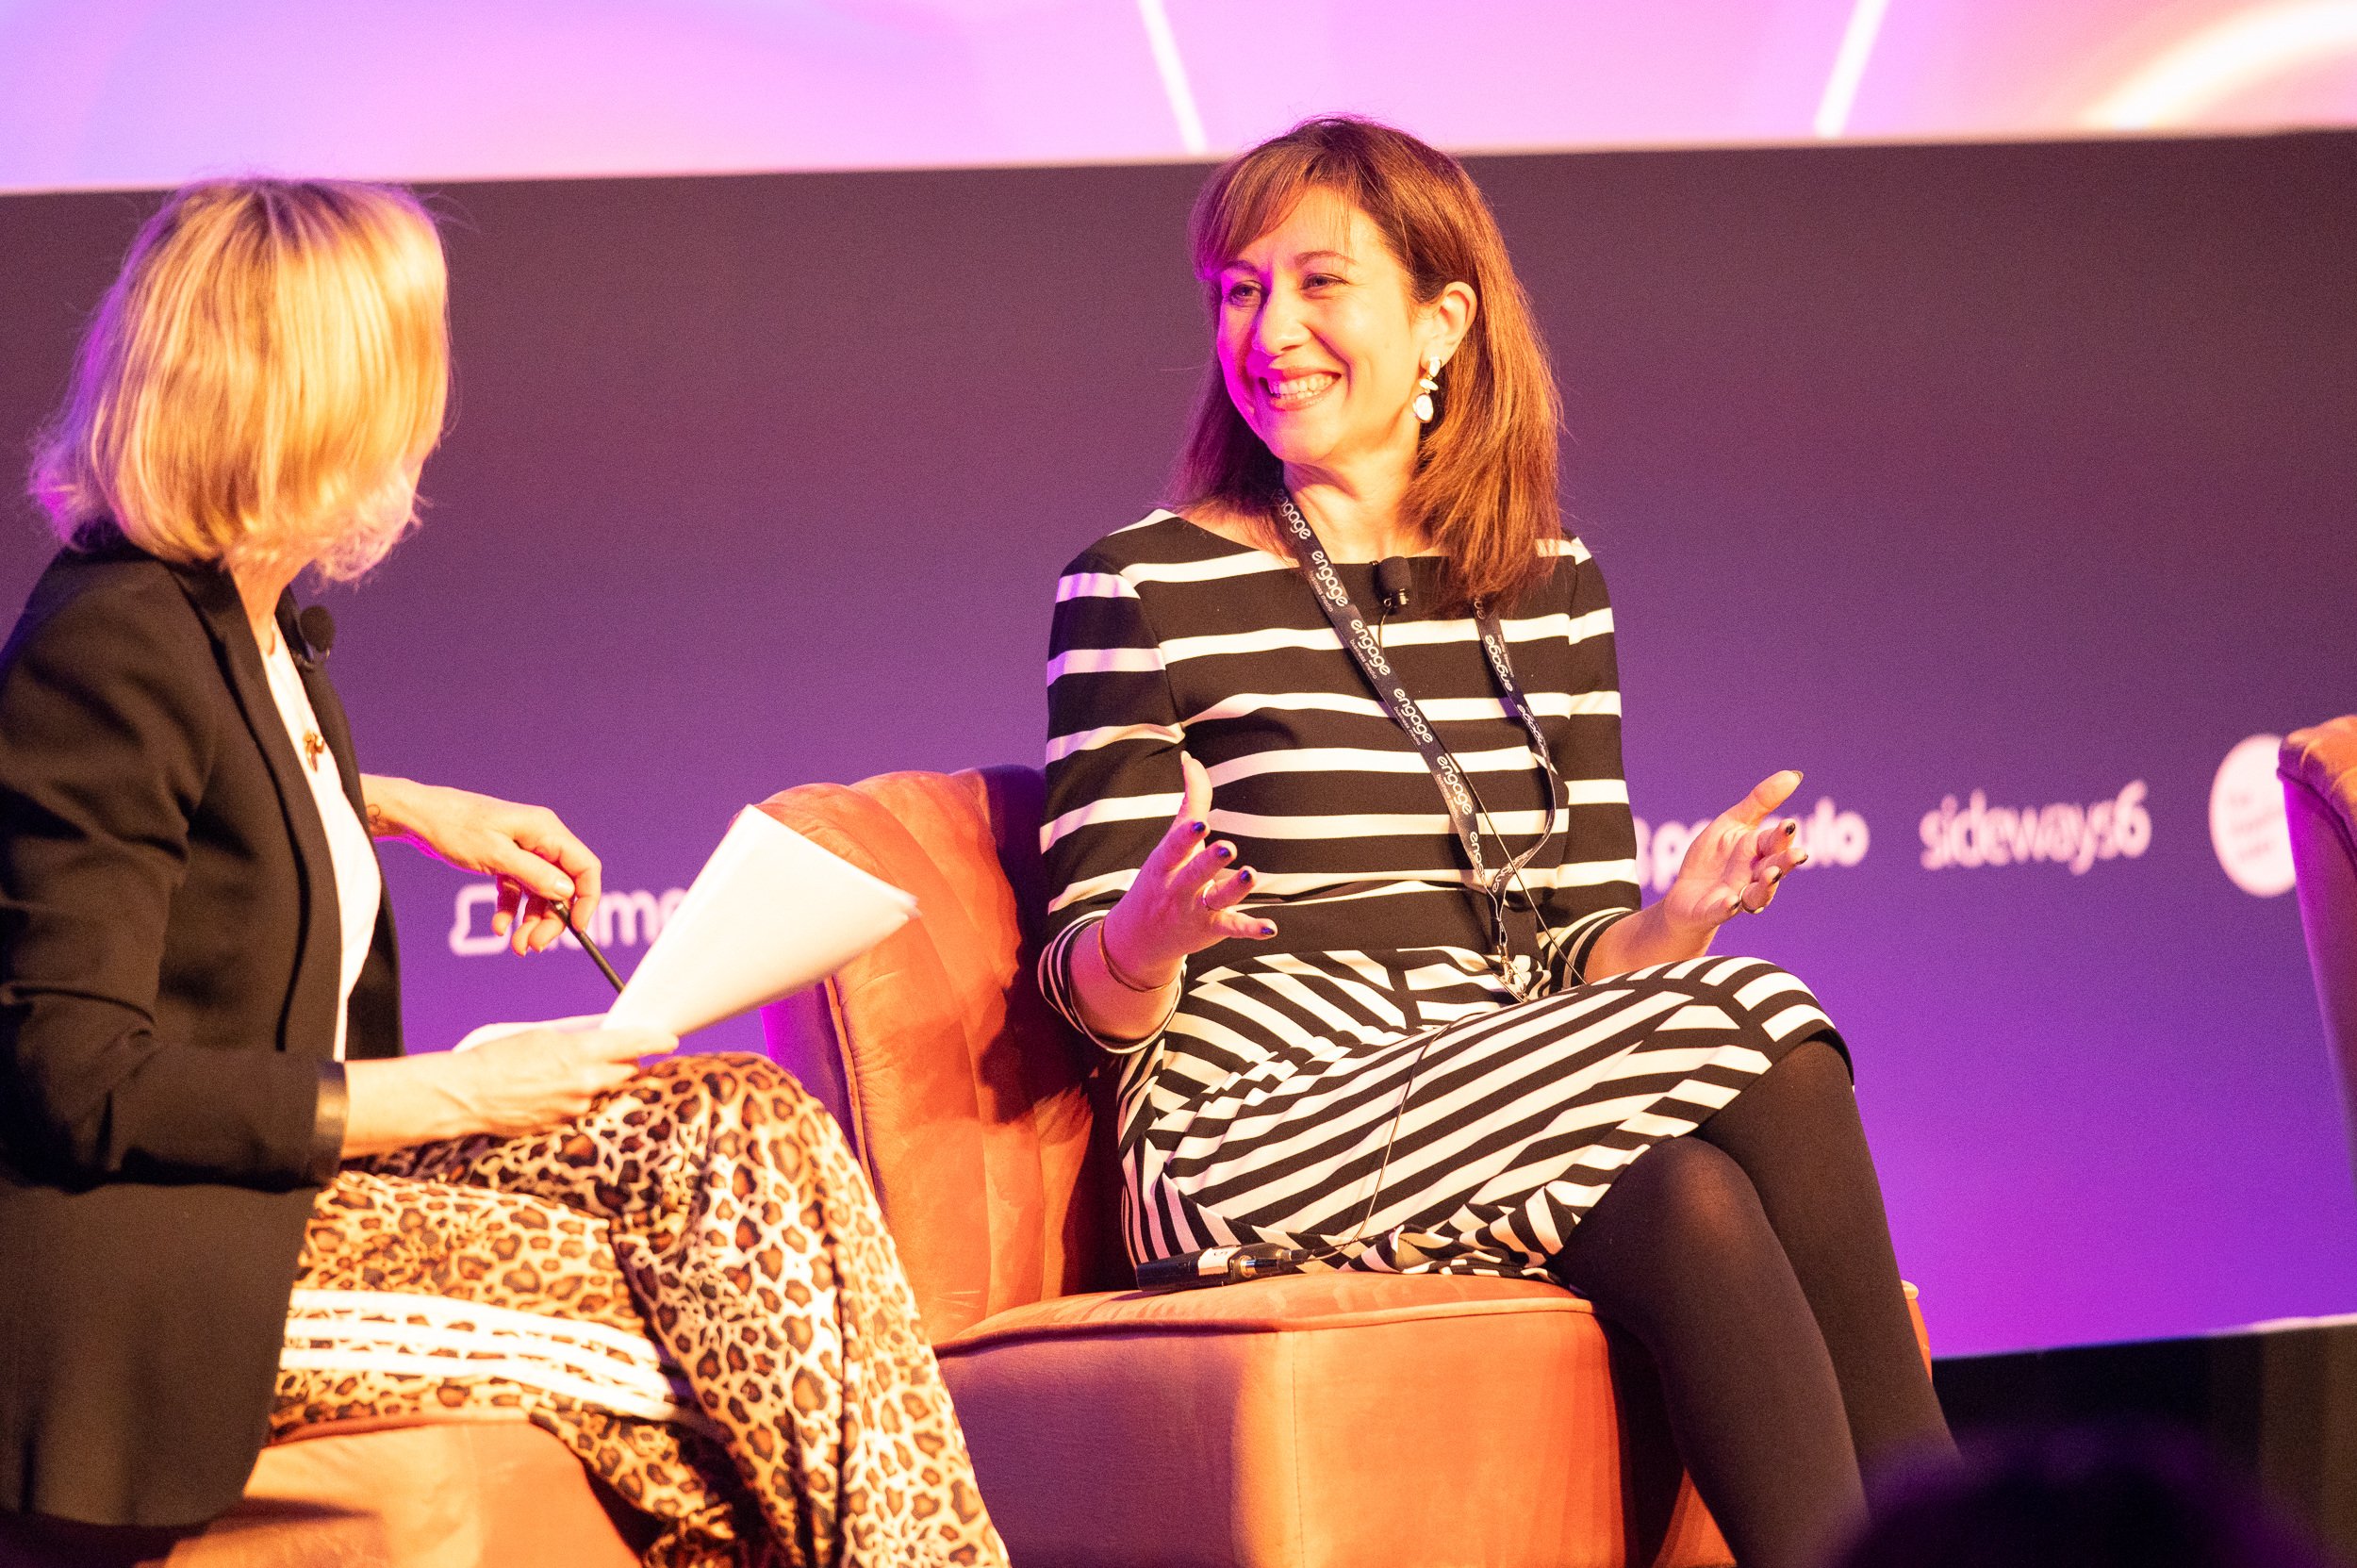
Following the 2024 Engage Awards, we’ve had the privilege of sitting down with our finalists to...
See the customer award categories and find out more information.
